


Strength in Numbers
Explore five ways you can use an advanced data analytics platform to power the entire multifamily lifecycle — from site selection, development and lease-up to ownership and operations, and acquisitions and dispositions.
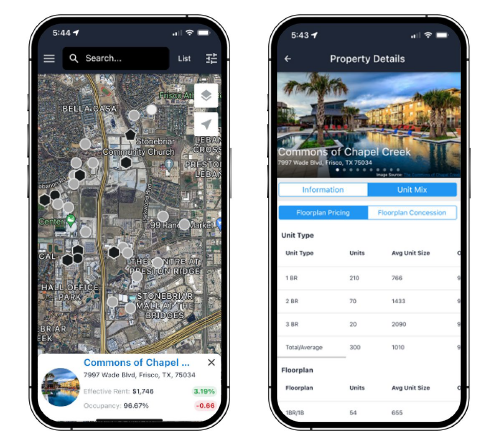
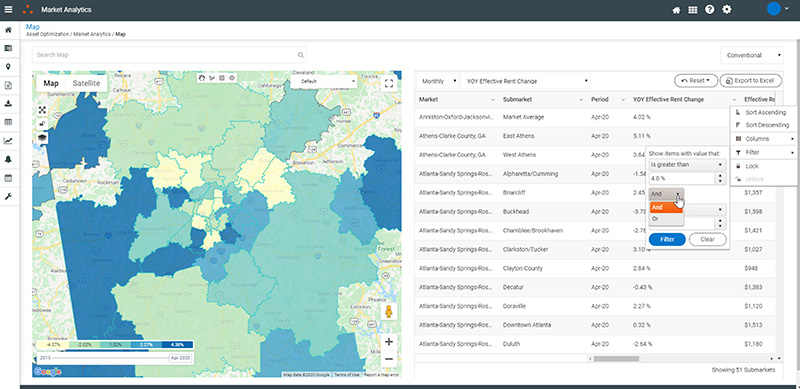
Receive instant on-the-go insights while traveling in market for conventional and student housing properties and competitive assets with granularity down to the floorplan level, plus visibility into new construction pipeline occurring or planned nearby.


RealPage Market Analytics, formerly Axiometrics, runs on unique lease transaction data, current survey data, the rental real estate industry’s deepest trove of historical data, Real Capital Analytics’ sales transaction data, and precise econometric modeling—for a powerhouse intelligence platform that helps stakeholders make capital allocation, construction, acquisition, management and disposition decisions with absolute confidence.
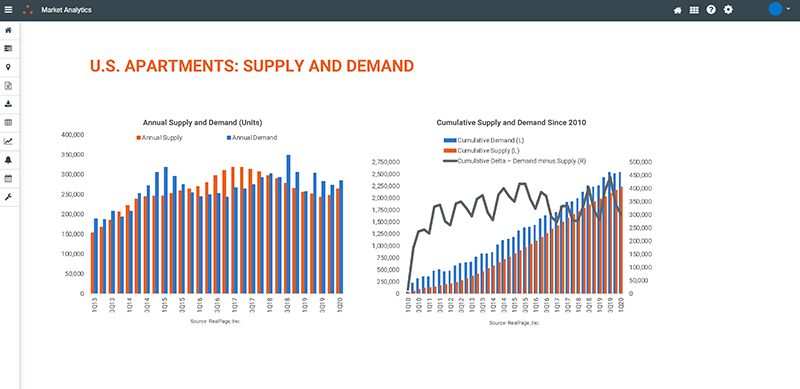
Actionable market, submarket, neighborhood and property intelligence on supply, demand, rent, concessions, occupancy trends, 5-year submarket level forecasts, and competitor analysis to increase rents and occupancy, reduce costs and grow revenue for property management companies.
Testimonial: BH Management Responds in Real Time with RealPage Market Analytics
Operate efficiently, generate desired cash flow and fuel NOI growth with actionable multifamily housing intelligence from market down to property levels that identifies trends, concessions, submarket forecasts and competitor insights to drive true property performance.
Testimonial: Simpson Housing Trusts Lease Transaction Data from RealPage Market Analytics
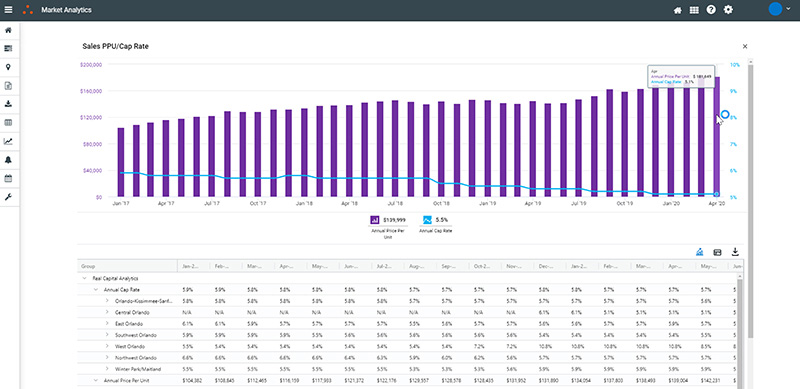
Drive superior asset performance, see trends in capital markets, realize maximum returns and mitigate risks with actionable market, submarket, neighborhood and asset intelligence that uncovers the best real estate investment opportunities.
Identify land acquisition and development opportunities in submarkets and neighborhoods with the highest expected risk adjusted return on investment and design, build and price the optimal asset to capture apartment demand.
Identify the best real estate loan origination opportunities, drive maximum returns and minimize risks with accurate market, submarket, neighborhood and asset intelligence.
Uncover prospects in multifamily property acquisition/disposition cycles, drive new property sales opportunities, facilitate deals, close sales and realize quicker returns with actionable market, submarket, neighborhood and property intelligence.
Discover sales opportunities, find properties, owners, property managers and decision-makers to target for services, close sales and realize growth with actionable market, submarket, neighborhood and property intelligence.
Explore five ways you can use an advanced data analytics platform to power the entire multifamily lifecycle — from site selection, development and lease-up to ownership and operations, and acquisitions and dispositions.
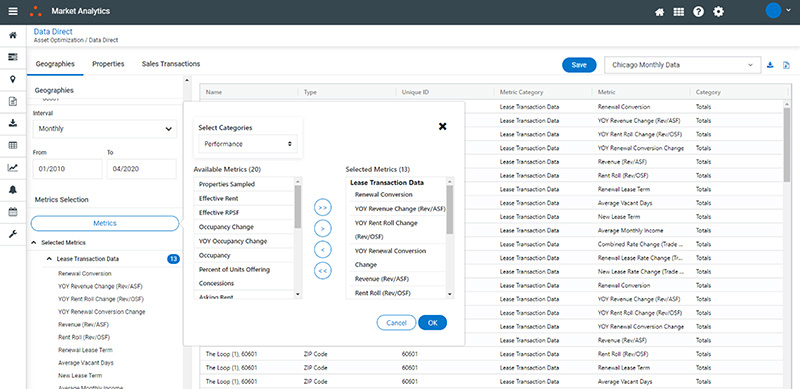
Most multifamily industry market performance measurement tools rely primarily on asking rents and occupancy survey data for KPI reporting—disclosing only 5% of property metrics. Multimillion-dollar decisions should not be based on blinded research. With lease transaction data, RealPage Axiometrics Market Analytics platform makes it possible to see real-time rent roll and revenue, compare new lease rent growth to renewals by market or submarket, and see retention rates, lease terms, average vacant days and other key intelligence to guide decision support.
“Market Analytics has been incredible for us. It's been a hole-in-one the way it's married the best of Axiometrics® with lease transaction data and other data sources to make it more robust for making solid decisions that help our investors and clients. Our teams feel super-confident leveraging it to tell us if we’re doing the right thing.”
Better understand the difference lease transaction data makes for more accurate market, submarket and property intelligence.
Now bundled with Market Analytics, Asset Intelligence from RealPage delivers a truly comprehensive real estate market intelligence platform that offers you 100% visibility into national, market, submarket and asset performance. Combining advanced, streamlined workflows with actual lease transaction data, world-class analytics and deep customization options, this single integrated solution is designed to expand access to the specific data sets that give your stakeholders total confidence and tailored insights that give you clearer vision, strategic focus and unprecedented flexibility to assess and improve your portfolio value.
In addition to possessing KPIs for nearly 1,000 universities, Market Analytics for Student Housing is supported by industry-leading economists, market analysts and data scientists providing rigorously tested econometric modeling and forecasting. Other capabilities for asset strategy support include:
Execute with certainty on your next residential development or investment with a custom feasibility study created and vetted by our team of senior economists and real estate analysts that includes micro-level insights to help secure financing and maximum apartment occupancy and rent performance. RealPage feasibility studies are some of the most detailed in the industry and comply with National Council of Housing Market Analysis (NCHMA) and United States Department of Housing and Urban Development (HUD) standards.
Join our live market update webcasts with the industry’s leading economists and analysts discussing market fundamentals, trends, forecasts and diving into performance by metros.
Stay up-to-date with the most accurate apartment intelligence—including trends and forecasts—and industry news from multifamily’s leading economists and analysts.
Paul Vastag’s biggest concern is mitigating risk. As VP of Business Intelligence for Continental Properties, he trusts RealPage Market Analytics to provide accurate intelligence to underwrite deals, evaluate investments and track performance across Continental’s 15,000-unit portfolio of townhome-style apartment homes.
Additional features that support the asset strategies of companies like Continental and the NMHC’s top owners, operators and property management companies include:


